Unit 1: Tenets of ScienceThe tenets of science are the things that are core to the idea of science, the ideas and characteristics that make science unique. This unit explores the various concepts the differentiate science from other disciplines like mathematics or history and explains why science is such an effective means of investigation. Here will we explore a number of different concepts including :
|
|
What is Science?
Science is more than just a class you take in school. Science is a verb, a method of exploring, understanding and testing the observable world. Science strives to be objective and unbiased- based in facts and avoid allowing personal preferences and opinions from skewing those facts. True science demands data to make a claim. For instance, stating that one object is prettier than other is not science. Prettier is subjective, pretty is a quality based in personal opinion and preference, not hard facts. Generally, scientists seeks to quantify their data to make it more effective and objective.
Objective vs. Subjective
To be objective means to remove one's own personal feelings and present only the facts. Subjective is the opposite of objective, inherently tying in one's own personal considerations. In science, it is always best to remain as objective as possible. The more factual you can remain, the stronger your investigation and conclusions will become. In a perfect world, this would be easily, but scientists are people and have their own opinions and feelings. As scientists, all we can do is our best in removing these feelings from our work and sticking to the data, the facts of what we are dealing with. There are a variety of ways this can be accomplished and we will explore them further in our discussion of bias.
To be objective means to remove one's own personal feelings and present only the facts. Subjective is the opposite of objective, inherently tying in one's own personal considerations. In science, it is always best to remain as objective as possible. The more factual you can remain, the stronger your investigation and conclusions will become. In a perfect world, this would be easily, but scientists are people and have their own opinions and feelings. As scientists, all we can do is our best in removing these feelings from our work and sticking to the data, the facts of what we are dealing with. There are a variety of ways this can be accomplished and we will explore them further in our discussion of bias.
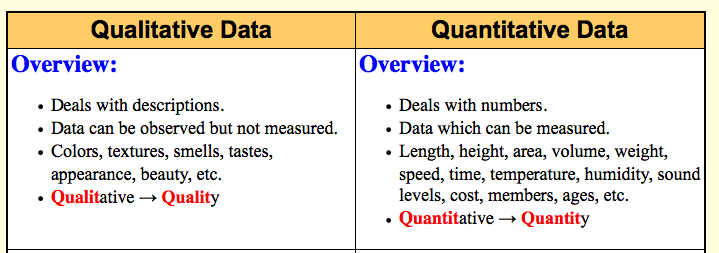
Quantitative vs. Qualitative
In science, there are two basic forms or types of data- quantitative data and qualitative data. Quantitative data relies on your ability to be able to count it or its quantity. For example, measurements of height, weight, growth and speed are all types of quantitative data as these can be measured and assigned hard numbers. Descriptions of how a person is feeling, how an animal is behaving or a color change are qualitative data as these rely not on the number or quantity of something but rather the quality of something. Qualitative data can be observed but not measured. In the statement, "there are 12 healthy orange trees in the year" there are both types of data. The fact there are 12 tree is quantitative and their being healthy is qualitative. In science, quantitative data is preferred because quantitative data is inherently more objective as it relies on numbers and measurements and not qualities that can be easily subjected to human bias.
In science, there are two basic forms or types of data- quantitative data and qualitative data. Quantitative data relies on your ability to be able to count it or its quantity. For example, measurements of height, weight, growth and speed are all types of quantitative data as these can be measured and assigned hard numbers. Descriptions of how a person is feeling, how an animal is behaving or a color change are qualitative data as these rely not on the number or quantity of something but rather the quality of something. Qualitative data can be observed but not measured. In the statement, "there are 12 healthy orange trees in the year" there are both types of data. The fact there are 12 tree is quantitative and their being healthy is qualitative. In science, quantitative data is preferred because quantitative data is inherently more objective as it relies on numbers and measurements and not qualities that can be easily subjected to human bias.
Accuracy and Precision
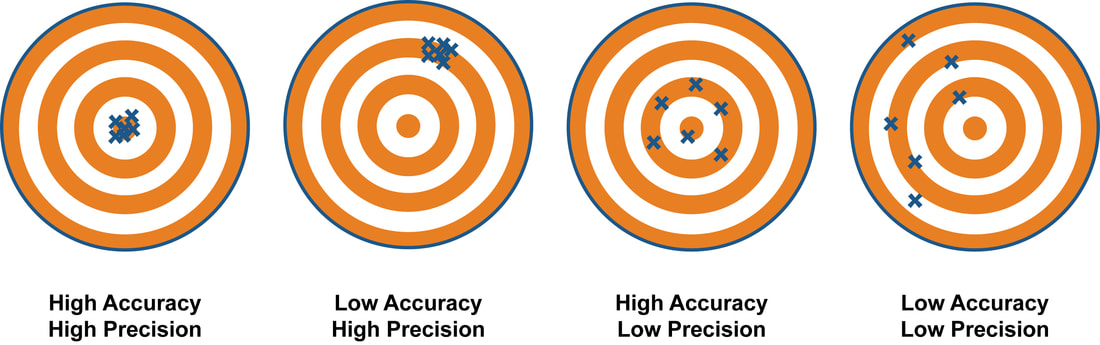
In science, accuracy describes how close measured data points are to their true value. For example, imagine a national park 10,000 hectares in size with 1000 bison. Rather than count every bison living on the 10,000 hectares, you and your team perform a field study on 1,000 hectares and find 10 bison. From this you extrapolate that their are 100 bison living in the entire park. How accurate were your results? Only about 10% accurate. In contrast, precision refers to how closely related measure data points are to each other or stated another way, if you take the same measurement more than once, do you get the same result? The image below helps to summarize these concepts.
In science, accuracy describes how close measured data points are to their true value. For example, imagine a national park 10,000 hectares in size with 1000 bison. Rather than count every bison living on the 10,000 hectares, you and your team perform a field study on 1,000 hectares and find 10 bison. From this you extrapolate that their are 100 bison living in the entire park. How accurate were your results? Only about 10% accurate. In contrast, precision refers to how closely related measure data points are to each other or stated another way, if you take the same measurement more than once, do you get the same result? The image below helps to summarize these concepts.
It is unlikely that you will be able to achieve 100% accuracy and precision in your lab. In fact, there will always be some uncertainty in your results. But good scientists strive to minimize that uncertainty and obtain the best, most objective results. This requires careful experimental design, which we will discuss further later on.
Correlation vs. Causation
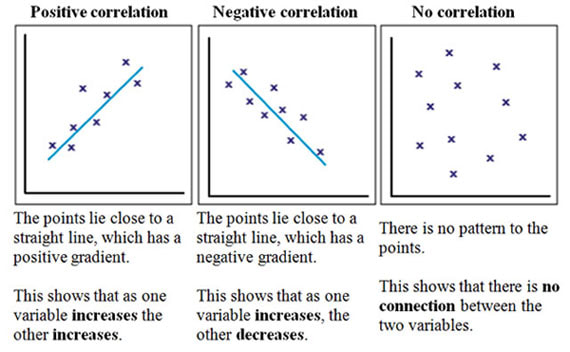
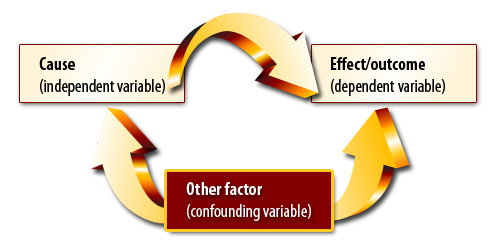
In statistics, a correlation exists whenever there is any type of connection or relationship between two variables. A causation (also called a causality) is a correlation in which there is a direct cause and effect relationship between the two variables, one causes the other. That distinct may seem subtle but it is fundamentally important to science. Correlation is a much broader and more inclusive term than causation; all causalities are correlations, but not all correlation are causations. Determining the relationship between variables requires careful observation and the accumulation of evidence from numerous, repeatable experiments.
In statistics, a correlation exists whenever there is any type of connection or relationship between two variables. A causation (also called a causality) is a correlation in which there is a direct cause and effect relationship between the two variables, one causes the other. That distinct may seem subtle but it is fundamentally important to science. Correlation is a much broader and more inclusive term than causation; all causalities are correlations, but not all correlation are causations. Determining the relationship between variables requires careful observation and the accumulation of evidence from numerous, repeatable experiments.
|
In a positive correlation, both variables increase together, but in a negative correlation, one variable increases as the other decreases.
Many examples of correlation in our every day lives. For example, electrical demands are correlated with the weather. On nice days, power demand is typically lower. This particular example is actually a causality, because when the weather is more violent or extreme, people require more electricity to perform various tasks like heating and cooling. In other words, the state of the weather has a direct effect on the demand for electricity; the nicer the weather, the lower the electrical demand and vice versa. |
|
But be careful, "correlation does not imply causation"; just because two variables have a connection does not always mean that one causes the other. For instance, people who eat organic foods are generally healthier than people of the same cohort (race, age, socioeconomic status, etc.) who eat conventional, processed foods. At first glance you might assume this is another causality, eating organic foods make you healthier, but the truth is far more complicated. In reality, there are more variables at play than just the food. People who eat organic foods also tend to be well educated and lead healthier lifestyles, they visit their doctor regularly, exercise and eat more balanced meals. In short, there simply is not sufficient evidence to conclude that eating organic foods makes you healthy, just that eating organic foods is associated or correlated with better health.
At a minimum, a causation such as "A causes B" can only form if the following conditions are met:
At a minimum, a causation such as "A causes B" can only form if the following conditions are met:
- A precedes B
- A and B express covariance (they change together)
- No other better explanation of the covariance of A and B exists.
Bias
Bias is a favorable view or preference for something including an individual, group or idea that should be removed from scientific investigations. Bias comes in an endless variety of forms and does not necessarily have to a be conscious intention and really can refer to anything that leads to a misrepresentation of a population of study. This is one of the reasons that quantitative data is more valuable than qualitative data- qualitative data relies on observations which are more easily influenced by human emotions than numbers and measurements. Bias is inherently subjective and has no place in pure science. Of course, all scientists are people and have their own opinions and views that bias their research. The goal of a scientist is not to remove their own personal biases from themselves but rather to work to exclude those biases from influencing their research and data.
|
Non-Response Bias
Non-response bias occurs during polling when the answers of those parties that did not respond differ from those that did. This is common with online reviews such as Yelp or Rate my Teacher. Typically, the only people leaving a review are those individuals that loved or hated a service or person while more moderate individuals leave no response because they simply are not motivated enough to. This non-response bias can make it difficult or even down right impossible to draw effective conclusions as the views expressed may only represent a small minority of the population. This occurred during the 1936 presidential election when the Literary Digest magazine announced their prediction that Alf Landon would win the election with 370 out of 531 electoral votes. In reality Landon only received 8 electoral votes. This mis-conclusion was the result of only a minority of voters returning their questionaries, about 20%. |


|
|
Confirmation Bias
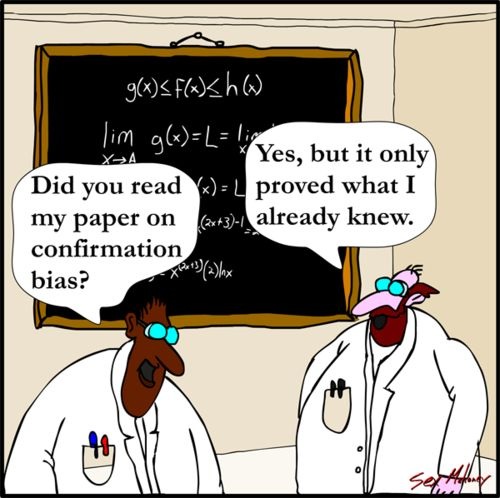
Bias comes in a variety of different forms including omission bias, design bias and sampling bias. It is beyond the scope of this course to discuss all the different types of bias, but we will focus on a few notable examples of bias. A common bias is when people selectively search for, recall and value evidence that supports their hypothesis. This is confirmation bias and can be very damaging in science, researchers will actually seek out and place more value on data that supports their own ideas over other data being collected. In reality, all data is equally significant and conformation bias leads to errors in collecting evidence. This is part of the reason it is often so difficult to change someone's mind, they will favor information or ideas that supports their initial argument over any contradictory evidence. A great example would be climate change. Because changes in global climate occur slowly and are often very subtle, people try to ignore them and dismiss climate change, despite clear evidence to the contrary. |
|
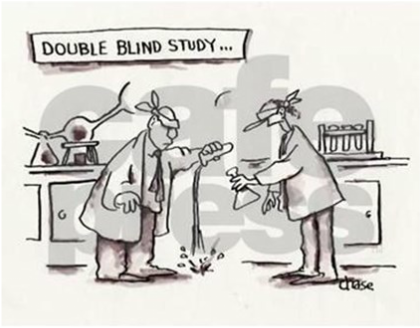
Please note: this is a cartoon, not an actual depiction of a double blind study.
|
Now imagine you are the researcher and believe you have finally created the perfect treatment for cancer. When it comes time for you to test the drug, you would be motivated to find any evidence to support your work and be subject to confirmation bias. During data collection a smart scientist will avoid this issue, by using double blind studies, especially in drug trial experiments like in the example provided. In a double blind study treatment is provided to some patients while others receive a fake treatment (the placebo). Neither the researchers nor the test subjects know which is which until the conclusion of the experiment. Since neither party knows if they got the treatment or the placebo, they do not know "how they are supposed to react" and cannot influence the result through conformation bias.
|
Another major example of bias is sampling bias in which some members of an intended population are less likely to be included than others. This results in a non-random sample that does not accurately reflect the population as a whole, which means the conclusions of the study are invalid. To avoid this issue when taking samples, strive for large population sizes that are random and reflect the population as a whole. A large population size will limit the effects of random chance and help ensure you get an accurate representation of the population. For instance, if you poll five people and one happens to have green eyes, you might conclude that 20% of the population will have green eyes, but in reality only about 2% of the world's population has green eyes. This is a case of sampling bias, In this example, the sample size was just too small and lead to an inaccurate result.
|
Consider conducting a scientific survey poll in the US. The United States has a population size of roughly 300 million people, 63.7% of whom are Non-Hispanic White, 16.3% Hispanic, 12.2% are Non-Hispanic Black, 4.7% Non-Hispanic Asian and 3.1% another race/ethnicity. Obviously it would be impossible to poll the entire population, so you will poll a sample population and apply your results to the entire population. When selecting people to poll, your numbers should correspond with these values and include a large sample size. So if you polled 1,000 people, about 630 should be White, 160 Hispanic, 120 Black, 50 Asian and 30 of other races/ethnicities. Of course, there are other demographics to consider when selecting a sample such as socioeconomic status, gender and age. So how do you consider all of these factors when selecting a sample? The answer is you do not! Creating a large, random sample will statistically ensure you get an accurate representation of the entire population. The larger the sample size, the more accurate your results will be.
Omission bias is the tendency to judge harmful actions as worse than non actions. A classic example would be the "allergy test." Imagine during a sporting event, you learnt that your opponent has a food allergy that could negatively affect his/her performance. Consider which is worse, knowingly offering food containing the allergen to your opponent or the opponent eating the food on their own and you neglect to warn them that is contains an allergen. While both of these scenarios end in the same way, most people tend to view the first (offering the opponent food with the allergy) as worse because of omission bias. Lastly, design bias is when treatment of research reflects outside interests. In other words, data and conclusions from experiments are actively skewed to support a preexisting idea. This can happen when corporations fund research and force scientists to make a choice between their work and their funding. This is why non-partisan research is so valuable and needed. |
|
Data Analysis
|
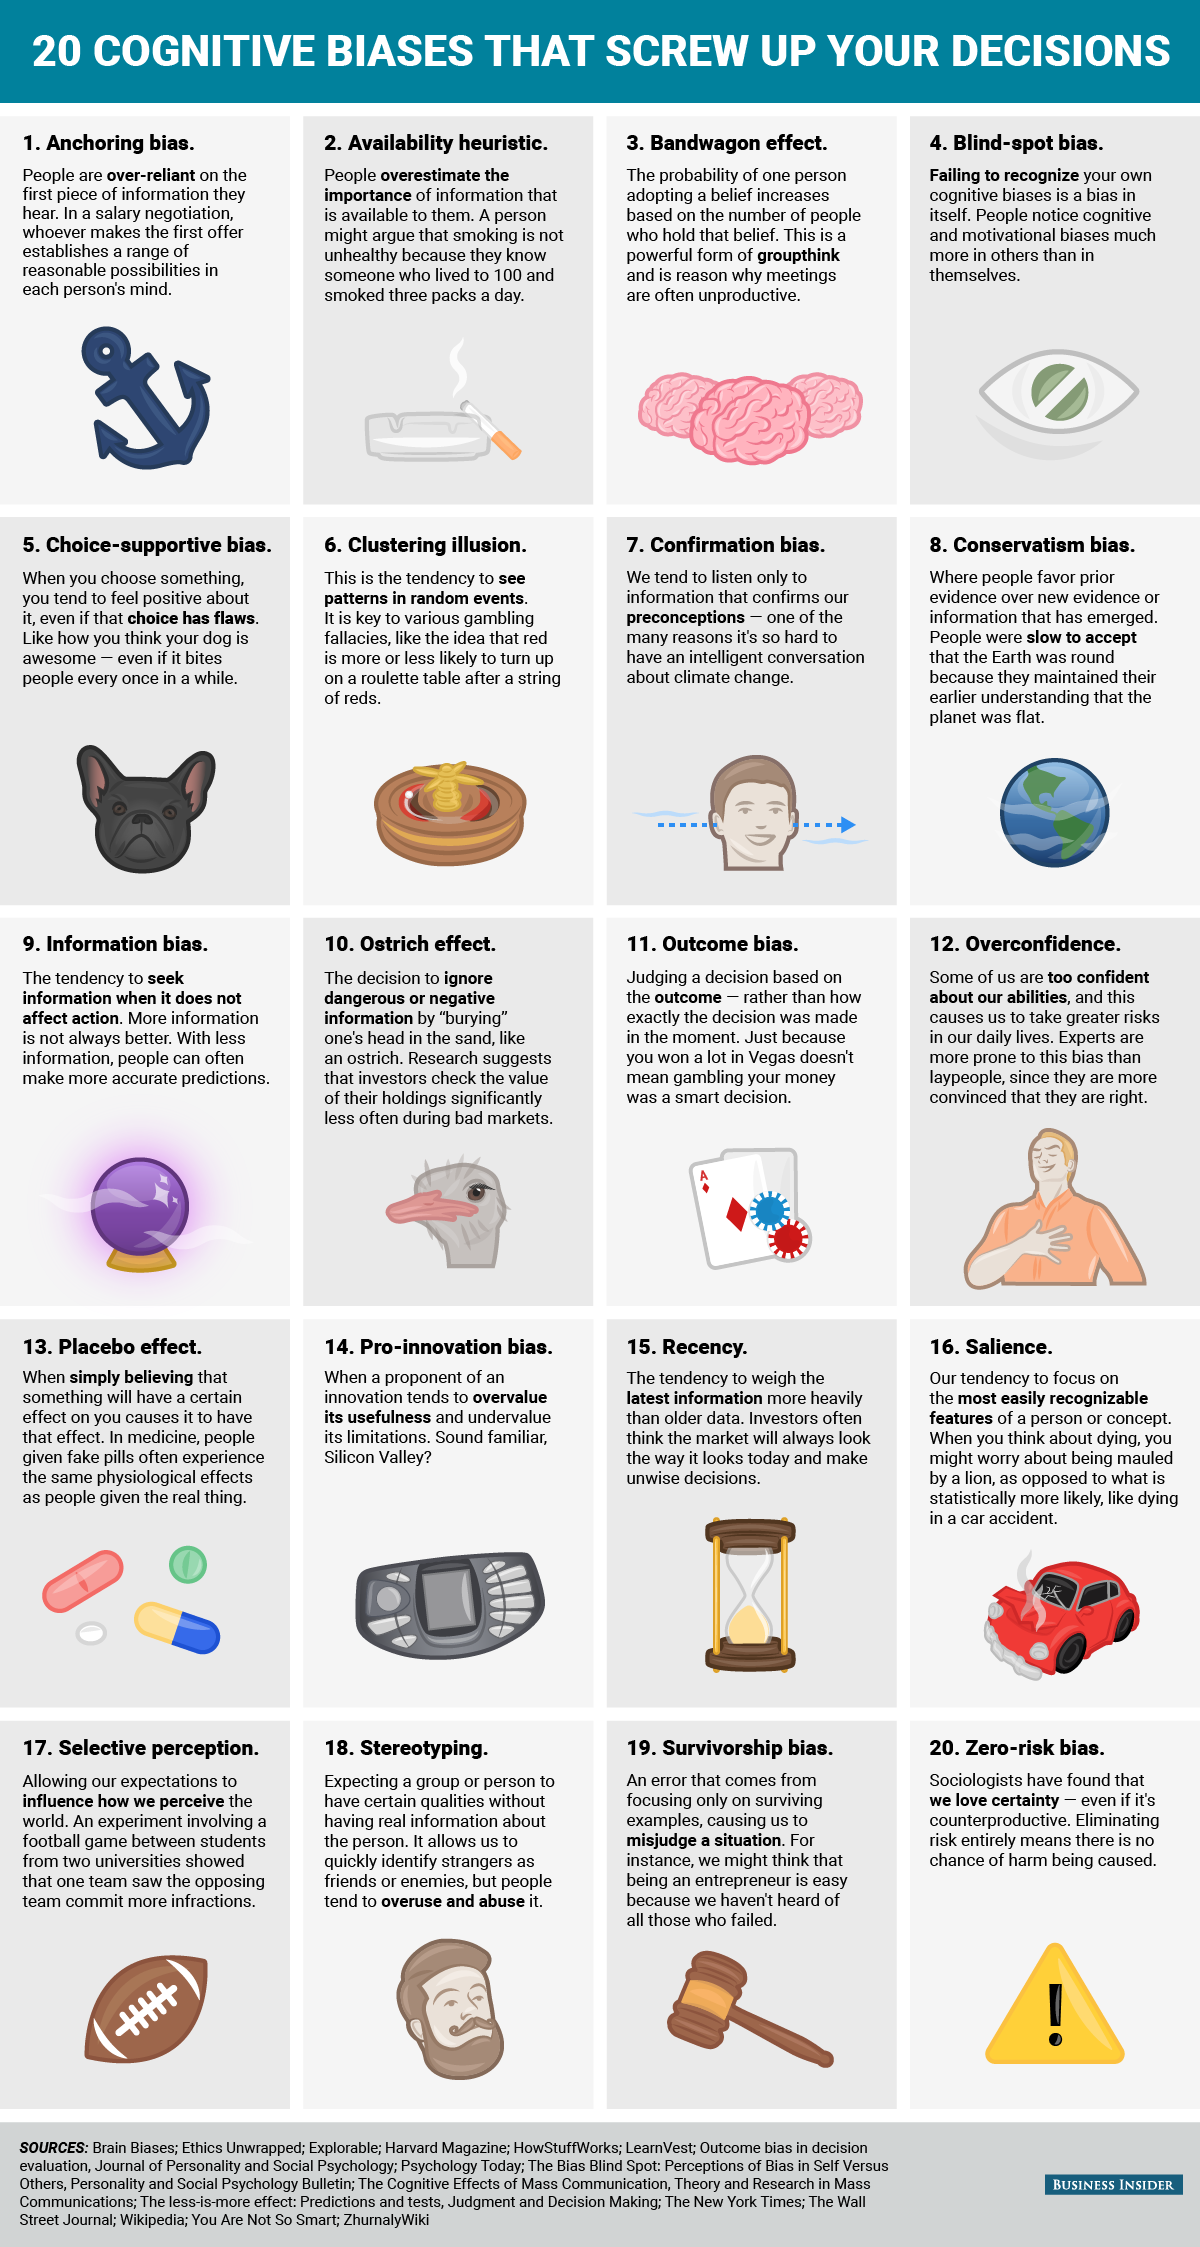
Because science speaks in the language of data, scientists must be proficient in data analysis. Graphing data is an excellent way to summarize and compare data. There are a great number of graphs available to summarize data, it is up to you to determine which is the most appropriate for the situation. For example, a line graph is best used to summarize a change over time.
|
|
Scientific Methodology and Experimental Design
|
Variables
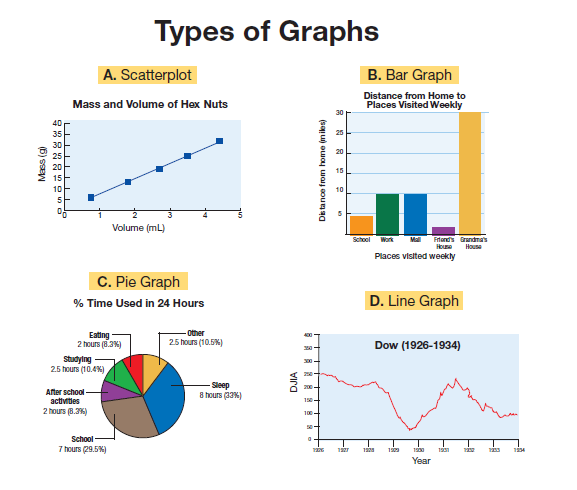
Just like in math class, scientists work with variables during experiments. Variables are specific conditions/features that can be changed or manipulated. In general, there are two types of variables: independent variables and dependent variables. An independent variable is one that you control, it is not affected by other variables in the experiment. For example, in an experiment with plants, the amount of water you provide to each plant would be an independent variable because you have complete control over that variable. A dependent variable is a variable that is controlled or affected by another variable. Going back to our example with plants, the dependent variable could be how tall the plants get as this would be directly related to how much water each plant received. |
|
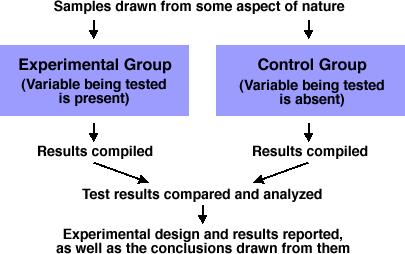
Experimental Design
Designing effective experiments is fundamental to science. A well designed experiment has specific components to ensure that accurate conclusions can be drawn from data collected during the investigation. In any investigation, it is important to establish a clear and objective hypothesis to guide the experiment. A hypothesis is a proposed explanation made on the basis of limited evidence used as a starting point for further investigation. Experiments test whether a hypothesis is correct or not by collecting evidence in the form of data. It may seem counter intuitive, but a good hypothesis does not necessarily have to be correct. A strong hypothesis establishes a relationship between the variables in an experiment in an objective and measurable way.
An example of a strong hypothesis would be: If more light is provided to plants, then the plants will grow taller, because plants require light to undergo photosynthesis and grow. Notice what makes this hypothesis strong: it is measurable, we can quantify how much light is provided to a plant and how tall plants grow. It is also objective, there is no room for subjectivity in analyzing the experiment and collecting data. Finally, this hypothesis establishes a clear relationship between the independent and dependent variables; as we increase the amount of light, the plants will grow taller.
A weaker hypothesis would rely on subjective measures like "prettiness" or "goodness" or fail to establish a clear relationship between the variables. The following would be a weak hypothesis: If more light is provided to plants, then the plants will grow better. In this hypothesis, it is unclear what is meant by growing "better". Do they mean grow faster, taller, greener? This ambiguity leaves the hypothesis open to criticism and weakens it overall effectiveness. Additionally, the hypothesis, "if plants receive light, they will grow taller" is less effective because it fails to establish a clear relationship between the amount of light provided and the height of the plant.
Hypotheses generally follow the "If, Then, Because" formula that helps to organize the relationship between the variables: If (manipulation of the independent variable), then (change in the dependent variable) because (prior knowledge or background research to support your conjecture). You will find that in college and beyond, scientists do not really follow this formula, think of it more as training wheels to help you practice developing strong hypotheses. Also, notice the significance of the because statement. This is where you include your background knowledge that lead you to develop your hypothesis and elevates strong hypotheses above simple, random guesses. The research also increases the objectivity of the hypothesis.
Once you have developed a hypothesis, it is time to generate the actual experiment. This will require a treatment, a control group and a least one experimental group. A treatment is the condition being tested in the experiment otherwise known as the independent variable. In the example hypothesis- If more light is provided to plants, then the plants will grow taller, because plants require light to undergo photosynthesis and grow- the amount of light provided to each plant would be the treatment.
Isolating variables in an experiment limits the influence of outside factors/forces.
|
A control group is a group of individuals in an experiment that do not receive the treatment. The purpose of the control group is for comparison, to see if the treatment has any affect on the test subjects. For example, when testing to see how drinking soda increases your risk of diabetes, you would need a group of individuals who did not drink soda to verify if drinking soda had any effect on the risk of diabetes. The experimental group would be the group that contains the test subjects, the individuals being provided the treatment. The experimental group allows you to measure the effect or dependent variable of the treatment. There should be multiple experimental groups included in a single experiment, each with its own varying level of treatment to test the relationship between the independent and dependent variable.
It is also important to have isolation of variables in your experiment; you should only test a single treatment in your experiment and all other factors should remain constant between your groups. If you test multiple independent variables at the same time, you will not know which one caused a change in the dependent variable. |
|
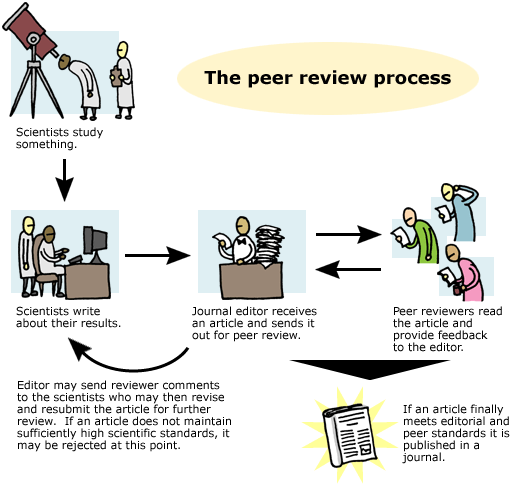
With your experiment now designed, you can adequately test your hypothesis. Using data collected during the experiment, you can either support or refute the hypothesis. Over time and with the right evidence, a hypothesis can be augmented into a scientific theory, a well-substaniated explanation of a natural phenomena. To do this requires multiple trials, repeatable results and peer review. Your experiment must be conducted over and over again to ensure its validity. The goal is to have repeatable results- each time your experiment is performed, by yourself and peer, or similar results are achieved. Finally, your worked must be reviewed by peers in scientific literature to ensure there are no errors in your experimental design that could skew you results. Peer review is one of the most important practices in science as it affords scientists the opportunity to get feedback from peers to improve their work and to snuff or falsified data and conclusions.
|
|
Scientific Theory vs. Scientific Law
A scientific theory is different from a scientific law, which serves to describe or summarize an event without explaining what the phenomena is or why it occurs. For example, the Law of Independent Assortment states that alleles of different genes separate independently of each other during gamete formation. Notice that the Law of Independent Assortment only summarizes what is happening, it does not explain why this event occurs- why the alleles are assorted independently. In contrast, consider the Theory of Evolution by Natural Selection which explains how species change over time and across generations as they compete to survive and reproduce in their environment. Notice that the Theory of evolution by Natural Selection explains what evolution is and why it occurs in nature. Both laws and theories are equally important in science and rooted in facts, they just serve different functions.
A scientific theory is different from a scientific law, which serves to describe or summarize an event without explaining what the phenomena is or why it occurs. For example, the Law of Independent Assortment states that alleles of different genes separate independently of each other during gamete formation. Notice that the Law of Independent Assortment only summarizes what is happening, it does not explain why this event occurs- why the alleles are assorted independently. In contrast, consider the Theory of Evolution by Natural Selection which explains how species change over time and across generations as they compete to survive and reproduce in their environment. Notice that the Theory of evolution by Natural Selection explains what evolution is and why it occurs in nature. Both laws and theories are equally important in science and rooted in facts, they just serve different functions.
Correlation vs. Causation
Correlation vs. Causation
In statistics, a correlation exists whenever there is any type of connection or relationship between two variables. A causation (also called a causality) is a correlation in which there is a direct cause and effect relationship between the two variables, one causes the other. That distinct may seem subtle but it is fundamentally important to science. Correlation is a much broader and more inclusive term than causation; all causalities are correlations, but not all correlation are causations. Determining the relationship between variables requires careful observation and the accumulation of evidence from numerous, repeatable experiments.
Many examples of correlation in our every day lives. For example, electrical demands are correlated with the weather. On nice days, power demand is typically lower. This particular example is actually a causality, because when the weather is more violent or extreme, people require more electricity to perform various tasks like heating and cooling. In other words, the state of the weather has a direct effect on the demand for electricity; the nicer the weather, the lower the electrical demand and vice versa.
But be careful, "correlation does not imply causation"; just because two variables have a connection does not always mean that one causes the other. For instance, people who eat organic foods are generally healthier than people of the same cohort (race, age, socioeconomic status, etc.) who eat conventional, processed foods. At first glance you might assume this is another causality, eating organic foods make you healthier, but the truth is far more complicated. In reality, there are more variables at play than just the food. People who eat organic foods also tend to be well educated and lead healthier lifestyles, they visit their doctor regularly, exercise and eat more balanced meals. In short, there simply is not sufficient evidence to conclude that eating organic foods makes you healthy, just that eating organic foods is associated or correlated with better health.
At a minimum, a causation such as "A causes B" can only form if the following conditions are met:
- A precedes B
- A and B express covariance (they change together)
- No other better explanation of the covariance of A and B exists.
Characteristics of Life
|
What makes life alive?
The question of what defines a "living" organism is one scientists have had to wrestle with for centuries. This is because of the enormous diversity of life that makes it difficult to identify the key traits that unite all living organisms. For instance, looking at yourself as a reference point, you might conjecture that all organisms have some locomotive ability, at least a basic level of cognition and should have some substantial size to them. But these traits CANNOT be applied to all organisms. |
|
Life ranges in size from the very small (microscopic bacteria) to the very large (100 foot long blue whales) making it impossible to impose a size requirement when examining life. And while humans and many other mammals may be able to move around under their own power (locomotion) and think and problem solve (cognition), this does not apply to all organisms, let alone all animals. Sponges are sessile, marine animals that are unable to move at all and lack an advanced nervous system to allow them to think and problem solve. The same applies to many plants and fungi. So we must look elsewhere when attempting to define what it means to be alive.
Below are the characteristics of life as organized by myself. Other sources may organize them differently, but the key is that in order for an organism to be unquestionably considered alive, it must in some way fulfill all of the traits listed.
Below are the characteristics of life as organized by myself. Other sources may organize them differently, but the key is that in order for an organism to be unquestionably considered alive, it must in some way fulfill all of the traits listed.
|
|
|
|
|
|
|
|
|
|

|
|
|
|
|
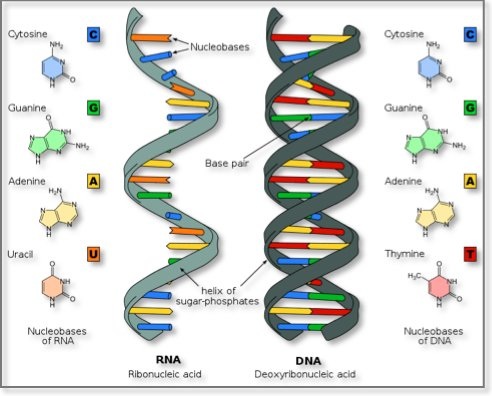
Viruses
Viruses are interesting from a biologist's perspective. Viruses have shown they can and do evolve, often very quickly. This was the case with the AIDS virus HIV, which jumped from a chimpanzee host to a human rapidly adapting to its new environment. Influenza, the virus responsible for the flu, has accomplished the same feats as seen with the bird and swine flue. But viruses lack a true cellular structure, they are usually composed of nothing more than a protein coat and genetic material. Some, but not all viruses use DNA as their genetic material, others (called retroviruses like HIV) use RNA to store genetic material. Viruses can reproduce, but require a host to do so, they lack the machinery to reproduce on their own. In many ways viruses are like little machines, they don't grow or develop over time, have no independent metabolism and outside of having a protein coat for a protective barrier, don't exhibit any homeostasis or response to the environment. With their metaphorical foot in both camps, the question of whether or not viruses are living remains ambiguous. |

|
